
Please wait while we process your request
Please wait while we process your request
Try it now!
Calculate your price
Number of pages:
![]() 2206
2206
![]() 7th Mar 2017
7th Mar 2017
In order to conduct the financial performance of the company we will be using the help of ratio analysis so as to understand the real financial position of the company. In addition to it, we shall also compare the financial performance with one of the core competitors of the company, i.e., Kepel REIT. Before conducting the ratio analysis , it will be useful for us to have a look over the financial statements of both the companies:
If you are in a hurry and stuck right at the beginning of the paper, then looking for someone to help with reflective papers will be the wisest decision. In such case we’d like to recommend you a Pro-Papers essay writing service.
CapitalMall Trust Balance Sheet:
| CAPITAMALL TRUST BALANCE SHEET | ||||
| Fiscal year ends in December. | 2009 | 2010 | 2011 | 2012 |
| Assets | ||||
| Real estate properties | 5 | 4 | 2 | |
| Accumulated depreciation | -3 | -3 | ||
| Real estate properties, net | 2 | 2 | 2 | 2 |
| Cash and cash equivalents | 351 | 713 | 758 | 1118 |
| Other assets | 7070 | 7411 | 8413 | 8768 |
| Total assets | 7423 | 8126 | 9172 | 9889 |
| Liabilities and stockholders' equity | ||||
| Liabilities | ||||
| Short-term borrowing | 440 | 927 | 782 | 405 |
| Long-term debt | 1767 | 1925 | 2641 | 3162 |
| Other liabilities | 247 | 335 | 502 | 618 |
| Total liabilities | 2453 | 3187 | 3926 | 4186 |
| Stockholders' equity | ||||
| Accumulated other comprehensive income | 4970 | 4939 | 5246 | 5703 |
| Total stockholders' equity | 4970 | 4939 | 5246 | 5703 |
| Total liabilities and stockholders' equity | 7423 | 8126 | 9172 | 9889 |
CapitalMall Trust Income Statement:
| CAPITAMALL TRUST INCOME STATEMENT | ||||
| Fiscal year ends in December. | 2009 | 2010 | 2011 | 2012 |
| Revenue | 553 | 581 | 631 | 662 |
| Expenses | ||||
| Operating expenses | 176 | 180 | 320 | 216 |
| Sales, General and administrative | 39 | 39 | 42 | 48 |
| Total expenses | 215 | 219 | 362 | 265 |
| Operating income | 338 | 362 | 268 | 397 |
| Interest income | 7 | |||
| Interest expenses | 105 | 118 | 139 | |
| Other income (expense) | -296 | 27 | 116 | 270 |
| Income before income taxes | -63 | 270 | 384 | 534 |
| Provision for income taxes | 2 | 0 | -2 | |
| Other income | ||||
| Net income from continuing operations | -65 | 270 | 384 | 536 |
| Net income | -65 | 270 | 384 | 536 |
| Net income available to common shareholders | -65 | 270 | 384 | 536 |
| Earnings per share | ||||
| Basic | -0.02 | 0.08 | 0.12 | 0.04 |
| Diluted | -0.02 | 0.08 | 0.12 | 0.04 |
| Weighted average shares outstanding | ||||
| Basic | 2921 | 3182 | 3206 | 3567 |
| Diluted | 3112 | 3367 | 3426 | 3567 |
| EBITDA | 43 | 390 | 270 | 675 |
CapitalMall Trust Cash Flow Statement:
| CAPITAMALL TRUST Statement of CASH FLOW | ||||
| Fiscal year ends in December. | 2009 | 2010 | 2011 | 2012 |
| Cash Flows From Operating Activities | ||||
| Inventory | 0 | 0 | 0 | 0 |
| Other working capital | 5 | 17 | 0 | 56 |
| Other non-cash items | 351 | 366 | 381 | 404 |
| Net cash provided by operating activities | 356 | 383 | 381 | 459 |
| Cash Flows From Investing Activities | ||||
| Investments in property, plant, and equipment | -66 | -323 | -597 | -1 |
| Property, plant, and equipment reductions | 0 | 0 | 0 | 0 |
| Acquisitions, net | 15 | |||
| Sales/Maturities of investments | 118 | |||
| Other investing activities | 11 | 12 | -119 | -250 |
| Net cash used for investing activities | -54 | -311 | -716 | -119 |
| Cash Flows From Financing Activities | ||||
| Debt issued | 18 | 1214 | 1246 | 1163 |
| Debt repayment | -991 | -545 | -695 | -956 |
| Common stock issued | 1232 | 250 | 250 | |
| Cash dividends paid | -266 | -295 | -300 | -312 |
| Other financing activities | -127 | -69 | -121 | -126 |
| Net cash provided by (used for) financing activities | -134 | 305 | 380 | 20 |
| Net change in cash | 167 | 377 | 45 | 361 |
| Cash at beginning of period | 168 | 336 | 713 | 758 |
| Cash at end of period | 336 | 713 | 758 | 1118 |
| Free Cash Flow | ||||
| Operating cash flow | 356 | 383 | 381 | 459 |
| Capital expenditure | -66 | -323 | -597 | -258 |
| Free cash flow | 290 | 60 | -216 | 202 |
Kepel REIT Balance Sheet:
| KEPPEL REIT BALANCE SHEET | ||||
| Fiscal year ends in December. | 2009 | 2010 | 2011 | 2012 |
| Assets | ||||
| Real estate properties, net | 0 | 0 | ||
| Cash and cash equivalents | 576 | 50 | 86 | 102 |
| Intangible assets | 33 | 37 | 138 | 92 |
| Other assets | 2023 | 3029 | 5633 | 5945 |
| Total assets | 2632 | 3116 | 5857 | 6139 |
| Liabilities and stockholders' equity | ||||
| Liabilities | ||||
| Short-term borrowing | 511 | 155 | ||
| Long-term debt | 579 | 990 | 1683 | 2268 |
| Other liabilities | 50 | 70 | 188 | 251 |
| Total liabilities | 629 | 1060 | 2381 | 2674 |
| Stockholders' equity | ||||
| Common stock | 2772 | |||
| Retained earnings | 723 | |||
| Accumulated other comprehensive income | 2003 | 2056 | 3475 | -29 |
| Total stockholders' equity | 2003 | 2056 | 3475 | 3466 |
| Total liabilities and stockholders' equity | 2632 | 3116 | 5857 | 6139 |
Kepel REIT Income Statement:
| KEPPEL REIT INCOME STATEMENT | ||||
| Fiscal year ends in December | 2009 | 2010 | 2011 | 2012 |
| Revenue | 63 | 85 | 78 | 157 |
| Expenses | ||||
| Operating expenses | 22 | 30 | 27 | -65 |
| Sales, General and administrative | 13 | 44 | ||
| Total expenses | 35 | 30 | 27 | -22 |
| Operating income | 28 | 55 | 51 | 179 |
| Interest income | 23 | |||
| Interest expenses | 46 | |||
| Other income (expense) | -72 | 58 | 229 | 215 |
| Income before income taxes | -44 | 113 | 302 | 348 |
| Provision for income taxes | 2 | 3 | 6 | 15 |
| Other income | -6 | |||
| Net income from continuing operations | -46 | 109 | 290 | 333 |
| Other | 6 | |||
| Net income | -46 | 109 | 296 | 333 |
| Other distributions | 6 | 3 | ||
| Net income available to common shareholders | -46 | 109 | 290 | 330 |
| Earnings per share | ||||
| Basic | -0.06 | 0.08 | 0.2 | 0.13 |
| Diluted | -0.06 | 0.08 | 0.2 | 0.13 |
| Weighted average shares outstanding | ||||
| Basic | 811 | 1341 | 1421 | 2591 |
| Diluted | 811 | 1341 | 1421 | 2591 |
| EBITDA | 54 | 77 | 87 | 458 |
Kepel REIT Cash Flow Statement:
| KEPPEL REIT Statement of CASH FLOW | ||||
| Fiscal year ends in December. | 2009 | 2010 | 2011 | 2012 |
| Cash Flows From Operating Activities | ||||
| Investments losses (gains) | -26 | |||
| Other working capital | -16 | -36 | -49 | -23 |
| Other non-cash items | 71 | 98 | 87 | 100 |
| Net cash provided by operating activities | 55 | 35 | 38 | 77 |
| Cash Flows From Investing Activities | ||||
| Investments in property, plant, and equipment | -1 | -1 | ||
| Property, plant, and equipment reductions | 571 | |||
| Acquisitions, net | -1380 | -1601 | -79 | |
| Purchases of investments | -108 | -377 | -119 | -5 |
| Sales/Maturities of investments | 4 | 300 | ||
| Purchases of intangibles | -27 | -7 | ||
| Other investing activities | 45 | 47 | 107 | 163 |
| Net cash used for investing activities | -59 | -868 | -1622 | 79 |
| Cash Flows From Financing Activities | ||||
| Debt issued | 100 | 993 | 767 | 260 |
| Debt repayment | -100 | -585 | -4 | |
| Cash dividends paid | -66 | -77 | -96 | -212 |
| Other financing activities | 602 | -25 | 953 | -188 |
| Net cash provided by (used for) financing activities | 536 | 307 | 1620 | -139 |
| Effect of exchange rate changes | -1 | |||
| Net change in cash | 532 | -526 | 36 | 16 |
| Cash at beginning of period | 44 | 576 | 50 | 86 |
| Cash at end of period | 576 | 50 | 86 | 102 |
| Free Cash Flow | ||||
| Operating cash flow | 55 | 35 | 38 | 77 |
| Capital expenditure | -28 | -9 | ||
| Free cash flow | 8 | 29 |
Ratio Analysis
a) Liquidity Analysis:
These ratios indicates the ability of an entity to honor its short term obligations. Also known as pure balance sheet ratios, they help us in having an inside view of the working capital of the company.
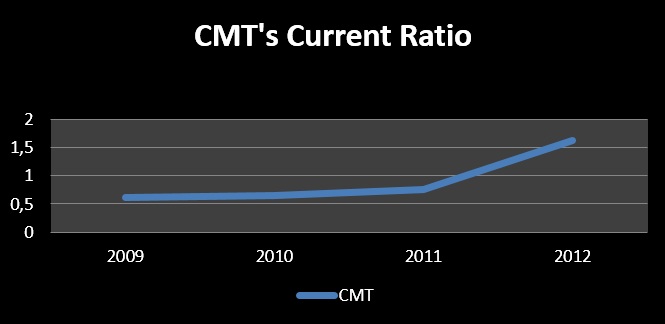
i) Current Ratio: Current Assets/ Current Liabilities
| Current Ratio | 2009 | 2010 | 2011 | 2012 |
| CMT | 0.62 | 0.65 | 0.76 | 1.63 |
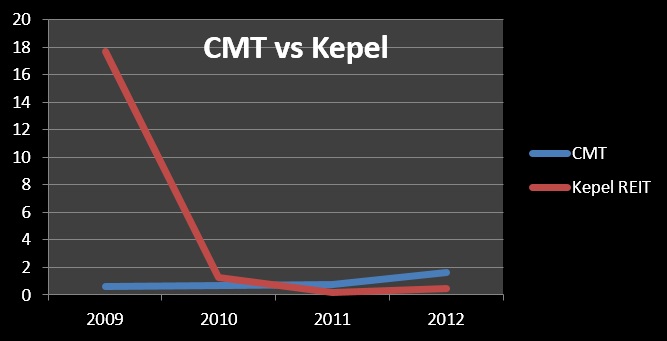
| Current Ratio | 2009 | 2010 | 2011 | 2012 |
| CMT | 0.62 | 0.65 | 0.76 | 1.63 |
| Kepel REIT | 17.67 | 1.3 | 0.18 | 0.43 |
** Since REIT do not manufacture or purchase any sort of inventory, there is no point of calculating their Quick Ratio
b) Profitability Analysis:
One of the most important ratios for the analyst and the investors of the company as it helps in understanding the profit margins being earned by the company.
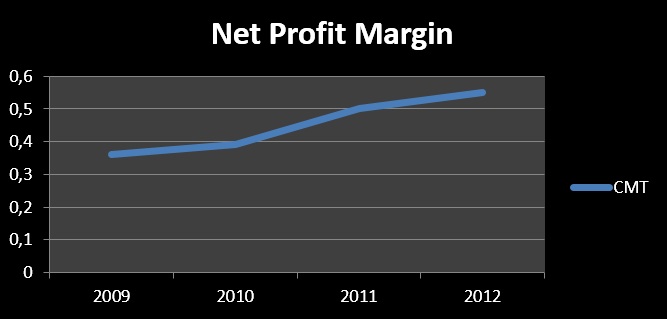
i) Net Profit Margins: Net profit/ Revenues*100
| 2009 | 2010 | 2011 | 2012 | |
| CMT | -11.79 | 46.47 | 60.93 | 81.07 |
| Net Profit Margin | 2009 | 2010 | 2011 | 2012 |
| CMT | -11.79 | 46.47 | 60.93 | 81.07 |
| Kepel REIT | -73.11 | 129.18 | 372.04 | 210.16 |
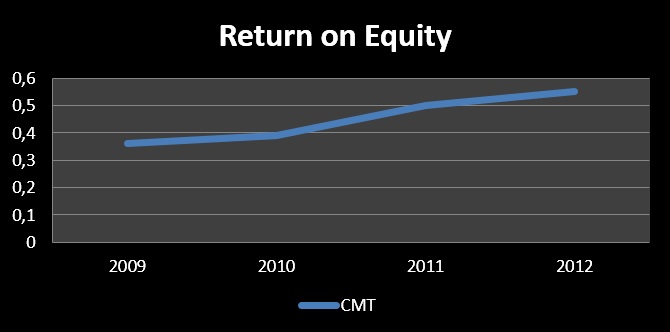
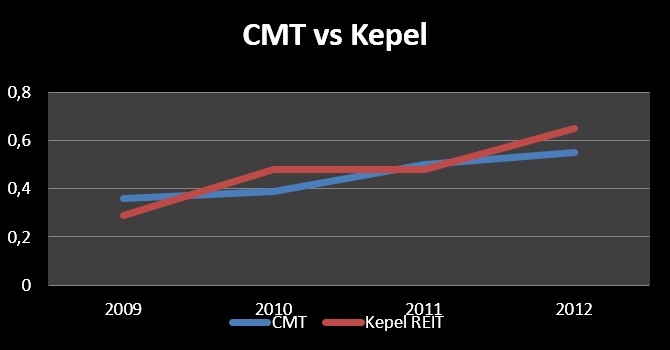
II) Return on Equity: Net Income/ Total Equity*100
| ROE | 2009 | 2010 | 2011 | 2012 |
| CMT | -1.44 | 5.45 | 7.54 | 9.8 |
| 2009 | 2010 | 2011 | 2012 | |
| CMT | -1.44 | 5.45 | 7.54 | 9.8 |
| Kepel REIT | -2.63 | 5.38 | 10.49 | 9.5 |
c) Solvency Ratios:
These ratios are used to judge the long term solvency of the company and also to adjudge the level of financial solvency in the company.
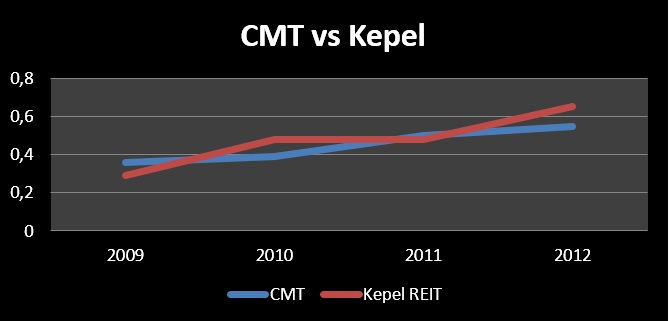
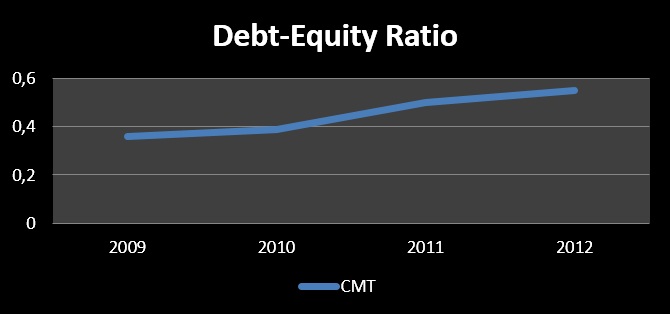
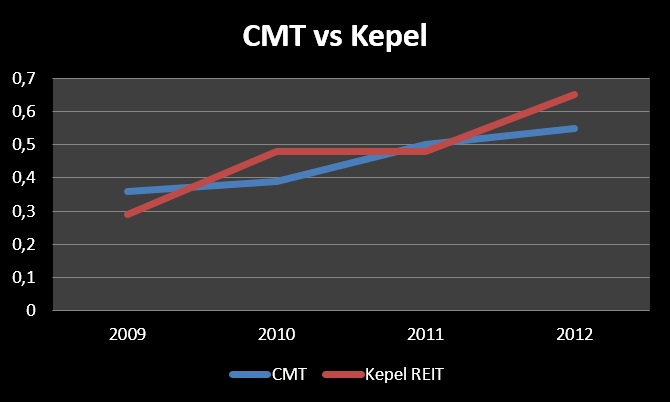
i) Debt Equity Ratio: Debt/ Equity
| 2009 | 2010 | 2011 | 2012 | |
| CMT | 0.36 | 0.39 | 0.5 | 0.55 |
| 2009 | 2010 | 2011 | 2012 | |
| CMT | 0.36 | 0.39 | 0.5 | 0.55 |
| Kepel REIT | 0.29 | 0.48 | 0.48 | 0.65 |
Analysis: Capital Mall Trust
Our above analysis for CapitalMall Trust indicates that over the years the company has improved its financial stability as displayed by the whole set of financial ratios. As for the liquidity analysis of the company, the current ratio of the company has improved year over year. By the end of 2012, the current ratio of the company stood at 1.63. Similarly, in the profitability section, the net profit margin of the company after the financial crisis of 2008 has improved significantly over the years. While during 2009, the Net Profit Margin of the company was -11.80% to 81% during 2012. Even the shareholders of the company will be ecstatic to see increasing return on equity. Over the years, the ROE of the company has increased from -1.44% to 9.8%

In order to facilitate the peer comparison, we have conducted the ratio analysis of CapitalMall Trust’s core competitor in REIT Industry, i.e. Kepel REIT. The comparison between both the companies can be seen in the ratio analysis section so conducted above.
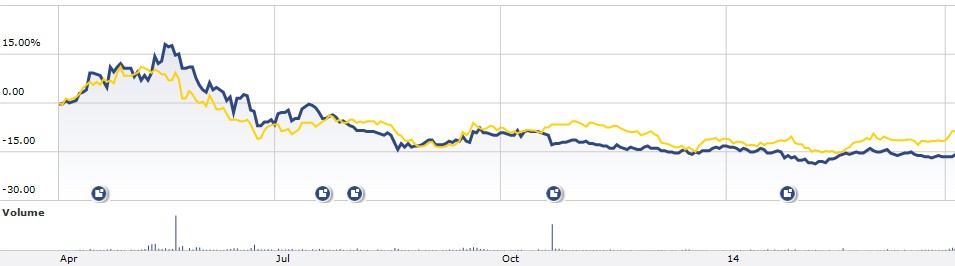
Referring to the above ratio comparison and graphs drawn we can infer that while CapitalMall Trust has been consistently growing with its financial stability, Kepel REIT has not been consistent in its performance. For instance, referring to the liquidity analysis of both the companies, while CMT has been successful in maintaining a health current ratio, Kepel REIT has saw a significant decline its Current ratio decreasing from 17(2009) to 0.43(2013)
The same scenario goes with the profitability analysis of both the companies. Although, post the global financial crisis years, i.e. the one beginning from 2009, both the companies managed to maintain high profitability rates but with passage of time, while CMT has been consistently and sustainably increasing its Net Profit Margins from 60.93%(2011) to 81.3%(2012), Keppel REIT saw a significant decline in its net profit margin during the same year of comparison from 372% to 210%.
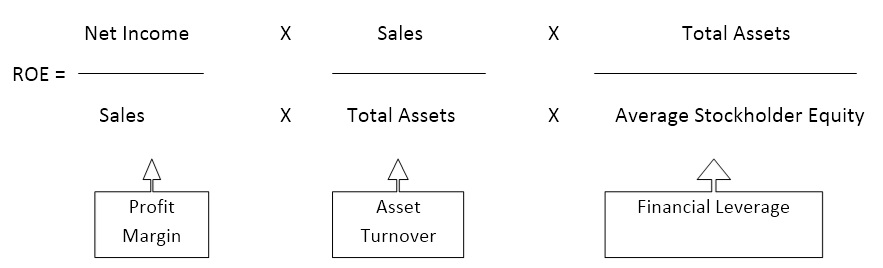
The three step Dupont Calculation:
DuPont Return on Equity model consists of three components to the calculation of return of equity; net profit margin, asset turnover and financial leverage multiplier.
Net profit margin is the calculation of after-tax profit generated from a company’s revenue by dividing net income over sales. Although net profit margin may vary across different industries, a higher net profit margin is generally more preferable.
Asset turnover ratio, on the other hand, is the measure of a company’s effectiveness in converting its assets into sales, which can be calculated by the division of sales over total assets. However, asset turnover ratio tends to be inversely related to net profit margin. In other words, the lower the net profit margin, the higher the asset turnover ratio. Thus, a low asset turnover ratio would be preferred.
Financial leverage multiplier, also known as equity multiplier, is the calculation of a company’s leverage on debts to artificially increase its return on equity. Equity multiplier enables the possibility for a company with poor sales and margins to uptake excessive debts in order to allow investors to see the portion of equity obtained from the result of debt. Financial leverage multiplier can be calculated by dividing total assets over shareholders’ equity.
3-Point DuPont Analysis-CapitalMall Trust
| Capitalmall Trust | ||||||
| 2009 | 2010 | 2011 | 2012 | |||
| Profit | -65,000,000 | 270,000,000 | 384,000,000 | 534,000,000 | ||
| Sales | 553,000,000 | 581,000,000 | 631,000,000 | 662,000,000 | ||
| Assets | 7423,000,000 | 8126,000,000 | 9172,000,000 | 9889,000,000 | ||
| Equity | 4970,000,000 | 4939,000,000 | 5246,000,000 | 5703,000,000 | ||
| Profitability | = | Profit Margin | -11.75% | 46.47% | 60.85% | 80.66% |
| Productivity | = | Asset Turnover | 0.0744 | 0.071 | 0.068 | 0.066 |
| Capital Structure | = | Financial Leverage | 1.49 | 1.64 | 1.74 | 1.73 |
| ROE | -1.31% | 5.42% | 7.20% | 9.21% | ||
The five step Dupont Calculation:
The five step Du-Pont Analysis is the extension to the three-step model. Under this method, net profit margin is expanded further with the inclusion of the tax effect in the Du Pont Equation. The 5-step equation builds with further extension of Net profit margin by changing the net profits into Earning before tax* (1-tax rate). Thus, ROE is transformed into:
ROE = (EBT/Sales)* (Sales/Assets)* (Assets/Equity)*(1-tax rate)
Need to write a cover letter with referral but you have no skills for that and looking for someone to help you out? Pro-Papers writing service is always ready to cover your back, so don’t hesitate to purchase your paper here.
Further breaking the Earnings before taxes into Earnings before interest and taxes minus the company’s interest expense. So by substitution, the ROE is transformed into:
ROE = [(EBIT/Sales)*) (Sales/Assets)* - (interest expense/assets]* (Assets/Equity)*(1-tax rate)
Or;
ROE= [(operating profit margin)*(asset turnover)-(interest expense rate)]* (equity multiplier)* (tax retention rate)
![]() Leave
a
Reply
Leave
a
Reply
Your email address will not be published / Required fields are marked *
Calculate your price
Number of pages:
Reset password
Reset password
We’ve sent you an email containing a link that will allow you to reset your password for the next 24 hours.
Please check your spam folder if the email doesn’t appear within a few minutes.